The recent posts to this blog have been concerned with the impact of COVID-19 on the U.S. dairy industry. This post will be a change. Data is now available for U.S. consumption of dairy products through the full year of 2019. This post will cover dairy consumption exclusively. The trends are pretty well known. Beverage milk consumption is continuing down, yogurt consumption is continuing down, cheese consumption continues to grow, and butter consumption is also continuing to grow. Ice cream consumption is stable. All added together the data based on milk fat equivalent is around 1.5 percent increase per year. Read to the end of this post to see the summary chart and long-term trend of the combined product consumption summary.
Consumption data for 2020 has been very erratic. For instance, beverage milk that has been declining for 20 years took a big leap in March of 2020. That increase was erased in the following months and was probably based on panic and hoarding at the start of the COVID-19 pandemic. The very rapid change from food service to retail buying has significantly skewed YTD dairy data for 2020. The emphasis in this post will therefore focus on firm data and trends through the end of 2019.
Most of the data presented below will follow per capita consumption. Total demand is based the size of the population and as well as per capita consumption. Chart I below shows the growth of the U.S. population. The rate of increase in the population of the U.S. is slowing. Over the last three years it has averages about .6 per cent annually. In 2000, the annual percent increase in population was nearly double that rate. The data in Chart I is based on the midyear population and should therefore be indicative of the average of the year.
If per capita consumption never changed, the demand for dairy products would be growing at .6 percent. However, as mentioned in the opening paragraph, the consumption of dairy products has been steadily changing.
 |
| Chart I - U.S. Population Growth |
The individual dairy products will be covered in roughly the order of their importance. Milk for cheese is roughly half of the total milk supply in the U.S. The 20-year growth rate is shown in Chart II and varies from year to year. It is growing at around two percent per year. Prior to the year 2000, the growth rate was much higher, sometimes as high as 10 percent per year. Over the last five years, the increase in per capita cheese consumption has averaged 2.3 percent. In 2019, the "average" American ate 38 pounds of cheese.
 |
Chart II - Per Capita growth of All Cheese Consumption
|
Cheese statistics are typically broken into two categories, American cheese which is primarily Cheddar and "Other" cheese which is primarily Mozzarella.
The growth of American cheese is shown in Chart III below. In 2019, the "average" American ate 15 pounds of American cheese. The growth of American cheese was relatively slow between 1980 and 2010, growing at just over one percent annually. Over the last five years American cheese has grown by 1.5 percent annually.
 |
Chart III - Per Capita Growth of the American Cheese Consumption
|
The growth of "Other" cheese is shown in Chart IV below. In 2019, the "average" American ate 23 pounds of "Other "cheese, primarily Mozzarella. The growth of "Other" cheese was relatively fast between 1980 and 2010, growing by three percent annually. Over the last five years it has grown by 2.2 percent annually.
 |
Chart IV - Per Capita Growth of Other Cheese Consumption
|
The fast growth of the "Other" cheese category between 1980 and 2010 is often credited to the fast-growing pizza business. By 2019, both categories of cheese are growing at about the same rate, just under one percent annually.
In conclusion, the cheese business is growing very nicely. The per capita rate in 2019 was growing by .9 percent and the population is growing at .6 percent. Therefore, the total grow rate for cheese consumption grew by around 1.5 percent in 2019. Over the last five years, cheese per capita consumption has grown faster, averaging 2.3 percent annually which with the growth in population would amount to an annual increase of about three percent. Overall, based on trends, a growth rate of around 2.5 percent annually can be expected.
Beverage milk is a very different story. As shown in Chart V below, per capita consumption of milk is declining. It has been declining for a very long time, but for much of that time the increasing population kept total milk consumption steady. Milk for drinking is now declining at a rate of 2.2 percent over the last five years and 2.7 percent over the last three years. It appears that the rate of decrease is growing. The trend line in Chart V substantiates a growing rate of decrease in beverage milk consumption. In the near future, a decrease of around 3 percent annually can be expected. Beverage milk was the largest use of milk, but that time is long gone.
 |
Chart V - Per Capita growth (decline) in Beverage Milk
|
In addition, the type of milk is also changing. Skim or No Fat milk has dropped by nearly 5 billion pounds per year or 58 percent over 20 years. Most of the decline started in 2012 and volume fell quickly. The introduction of plant-based "milk" in the refrigerated section in grocery stores made No Fat milk an easy target. One of the strong points of the plant-based products was the minimal amount of fat, but decent flavor. Of course, the plant-based products have a much different nutritional profile.
 |
Chart VI - Skim Milk Sales
|
One percent fat milk fell into the same trap, declining by nearly 2 billion pounds annually since 2012.
 |
Charr VII - One Percent Fat Milk Sales
|
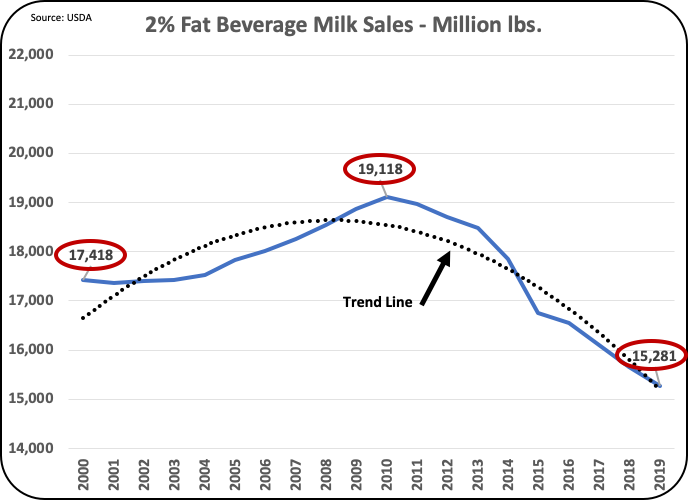
Two percent fat milk (Chart VIII) was recently the leading beverage product. It became the best-selling milk product in 2004 and held that title until 2018. Volume has fallen by nearly 4 billion pounds since 2010. One of the reasons behind this is the publication of studies touting the nutritional value of butterfat, especially for children.
 |
Chart VIII - Two Percent Fat Milk Sales
|
As a result, Whole milk (Chart IX) made a major comeback. Whole milk had fallen out of favor as there were concerns about the calories in butterfat. However, in 2013, the trends reversed and whole milk consumption began to grow. The growth was a positive note for the dairy industry, but it was not strong enough to overcome the overall beverage milk decline.
 |
Chart IX - Whole Fat Milk Sales
|
The decline of beverage milk has multiple impacts on the dairy industry. The decline has a major impact on producer prices as Class I milk for drinking is the highest priced milk. The decline has lowered the average or uniform price of producer milk as the highest priced category shrinks.
Because less butterfat is being removed from milk, there is less of this butterfat available for churning. This has put pressure on the butterfat supply for manufacturing butter. As shown below in Chart X, butter consumption is growing.
Butter consumption is a positive note. Per capita consumption of butter is growing at a three percent rate over the last five years. While plant based similar products have taken a lot of market share, concerns about saturated fats and a desire for more natural products has helped butter consumption grow. In the last two years. the growth rate has varied from 6.3 percent to 2.0 percent. The trend line would indicate an annual growth rate around of two percent.
 |
| Chart X - Per Capita Butter Consumption |
The growth rate of yogurt per capita consumption has been on a downhill slide for 20 years. Beginning in 2014, the growth rate changed from positive to negative. Yogurt is a small piece of the domestic use of milk. However, regionally it can be important. For the last five years yogurt has averaged a 1.4 percent annual decline. Because the rate of decline is growing, an annual decline of two percent annually can be expected for the near future.
 |
| Chart XI - Per Capita Yogurt Consumption |
To end this post with a sweet point, ICE CREAM consumption is growing. This writer can take credit for contributing to this success. Everyone should do the same. The category and the growth rate are small, but it is nice to see some growth.
 |
Chart XII - Per Capita Consumption of Ice Cream
|
The USDA provides a summary for this set of consumption data. They use a butterfat based equivalent to summarize the data from the different dairy products. The most recent five year average is a 1.9 percent increase in butterfat needed to meet demand. This is within the normal increases in milk volume per cow and the increases in component development. Overall, the U.S. cow population should not grow.
 |
Chart XIII - Fat Equivalent Consumption of All Dairy Products
|
All of the data above is based U.S. domestic consumption of dairy products. Exports and imports have not shown much new demand, but any added exports and lower imports would increase demand further. Hopefully the COVID-19 aberrations will abate and allow a more normal and predictable need for milk.
The data does show that the future of milk production is centered around components, not pounds of milk. More protein is needed for efficient cheese production and more butterfat is needed to supply the butter demand.
Future posts will continue to follow the dynamics of the rapidly changing dairy industry.


great work!
ReplyDeleteInterestinng thoughts
ReplyDelete